 By

The morning after Diwali, Delhi woke up to the familiar grey haze. This year it also woke up to a fight over the numbers. The Aam Aadmi Party has accused the Delhi government of manipulating air quality data, claiming that the AQI crossed 3,000 in several parts of the city on Diwali night, while the official figure was a fraction of that.
Let’s break down what AAP is alleging, what the official data says, why the two are so far apart, and what hasn’t been answered yet.
What AAP is alleging
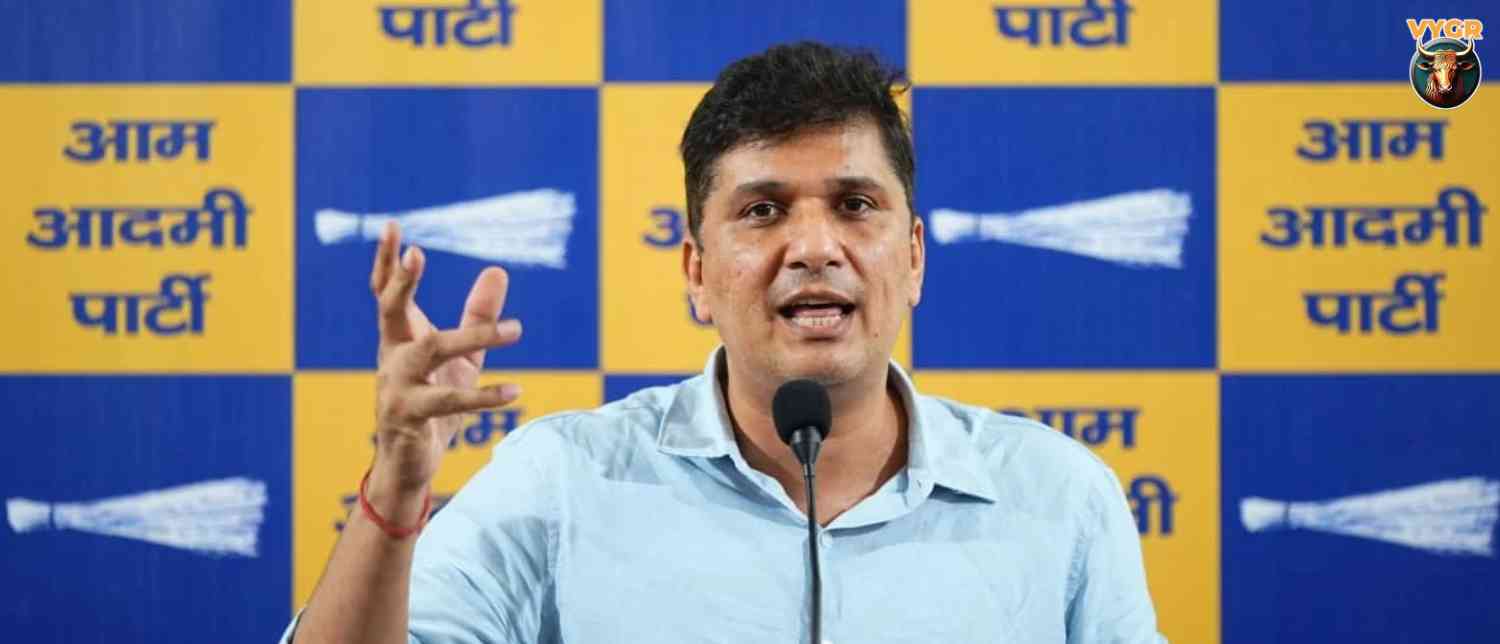
Saurabh Bhardwaj, president of AAP’s Delhi unit, made the claim on X and again in an interview. He said readings from multiple independent air quality monitoring platforms showed the AQI going past 3,000 at several locations on Sunday night. He accused the government of “AQI data fraud” and of misleading residents about how bad the air really is.
He also made a second, separate allegation: that monitoring stations had been shut down and about 20 new ones set up in remote, green areas of Delhi, which he said would skew the readings downward. In his words, people no longer trust the government’s air quality numbers, and he asked the government to present the “true” AQI. He added that if the government is encouraging fireworks, it should own up to it and take responsibility.
These are allegations by a political party. They have not been proven, and no investigation has been announced.
What the official data says
According to Central Pollution Control Board (CPCB) data, Delhi’s average AQI on Diwali, November 8, was 376, in the ‘very poor’ category. At 7 am on Monday, the city-wide average stood at 368, with 15 stations recording readings above 400, which is the ‘severe’ category.
| Official reading (Monday morning) | AQI |
|---|---|
| Delhi city-wide average (7 am) | 368 |
| Burari Crossing | 441 |
| Vivek Vihar | 437 |
| DTU | 434 |
| North Campus (DU) and Jahangirpuri | 433 each |
| Rohini | 430 |
It is worth noting what the official figures do and don’t say. They don’t say the air was fine. A city average of 368 with a string of stations in the severe range describes seriously bad air. The dispute is about whether it was this bad or something far worse.
What the independent platforms show
The numbers cited by AAP come from independent monitoring platforms, not from CPCB. One such platform reportedly showed an AQI of 1,331 at about 1:30 am and 663 at around 8 am on Monday, and another headline-level report mentioned a reading of 1,039 against the 368 on the government app. These are real-time readings from a private platform, separate from the official network.
None of the independent figures I found reached 3,000. That number is Bhardwaj’s claim, and I couldn’t trace the specific readings behind it.
Why the numbers can differ so much
A gap of this size doesn’t automatically mean someone is lying, and it doesn’t automatically mean someone isn’t. There are several technical reasons why two sets of numbers can diverge.
| Factor | What it means |
|---|---|
| Different instruments | Official stations use regulatory-grade equipment. Many independent platforms rely on low-cost sensors, which can read very high in smoke, fireworks and humidity |
| Different time windows | The official headline number is a 24-hour average. A real-time reading at 1:30 am during peak firecracker smoke can be many times higher |
| Different scales | The Indian AQI scale tops out at 500. Some platforms use other formulas that can display much higher numbers, so the two aren’t directly comparable |
| Different locations | Pollution near a firework hotspot can be dramatically worse than a station a few kilometres away |
| Different averaging | Instantaneous peaks and hourly or daily averages answer different questions |
These explanations are general, and none of them proves or disproves AAP’s claim. They simply show why comparing a real-time reading from one platform with an official daily average can produce a wide gap.
The monitoring-station claim
The charge about relocated stations is a separate question from the 3,000 figure, and it is one that can be checked. It would be answered by the locations, dates, and readings from the stations involved, and by what CPCB and the Delhi Pollution Control Committee say about any changes to the network. I haven’t found an official response addressing it directly.
How the government camp has responded
I didn’t find a direct, point-by-point reply from the Delhi government, CPCB or the Commission for Air Quality Management to the data-fraud allegation.
The wider political response has been sharp. BJP MP Praveen Khandelwal called the pollution row a political conspiracy by AAP and pointed the finger at stubble burning in Punjab. Delhi minister Kapil Mishra earlier alleged that a campaign was being run to target the festival of Diwali under the pretext of pollution.
So the argument has two layers. One is a factual dispute over the readings, and the other is a political contest over who is to blame for Delhi’s air.
Is this the first time?
No. Last year, AAP made a similar charge, alleging that government agencies had manipulated pollution data on Diwali night after a reading of 1,763 was reported at one monitoring station before it was shut down. At that time, the Delhi environment minister argued that Diwali had only a minimal effect on the city’s overall pollution. The repeat of the dispute suggests it is as much about trust in the data as about the data itself.
Why it matters
Whatever the truth about the 3,000 figure, the row points to a real problem. When residents, parties and independent platforms all see different numbers, it becomes hard to build agreement on how bad the air is and what to do about it. Clear, open data, including where stations are, how they are maintained and how readings are calculated, is the way to settle such arguments.
For ordinary Delhiites, the practical message doesn’t depend on who is right. Even by the official figures, the air on the morning after Diwali was ‘very poor’ to ‘severe’, and the usual precautions apply: limit time outdoors, avoid morning exercise, and use a mask or an air purifier if you can.
What happens next
Watch for a formal response from the Delhi government, CPCB or CAQM to AAP’s allegations, and for any call for an independent audit of monitoring stations. Pressure may grow for the authorities to publish the locations and status of every station, and for the raw data to be made available for checking. The political argument is likely to continue as the post-Diwali smog lingers.
© Copyright 2026. All Rights Reserved. Powered by Vygr Media.